
 |
|||||
 |
|||||
Next: Discussion Up: Results Previous: Parameter Evaluation
Multiresolution Registration
A spatial and frequency multiresoltion procedure was used to estimate the full resolution registration of the data sets used in the previous section. In this approach, global structures are matched before local to reduce the likelihood of incorrect local registration errors and to increase convergence. Table 3 shows the number of iterations, the harmonic increment iteration, the initial number of harmonics, and the final number of harmonics at each resolution. This schedule proceeds from low resolution to high resolution starting at one eight the spatial resolution and increases to full resolution.
A set of parameters were chosen from Tables 1
and 2 that gave a good trade-off
between the image intensity match, the inverse consistency of the transformations,
and low spatial distortion. The parameters used were time step = 0.00004,
![]() ,
,
![]() , and
, and ![]() for the MRI-to-MRI registration and time step = 0.0001,
for the MRI-to-MRI registration and time step = 0.0001,
![]() ,
,
![]() , and
, and ![]() for the CT-to-CT registration. These parameters were used
at all resolutions.
for the CT-to-CT registration. These parameters were used
at all resolutions.
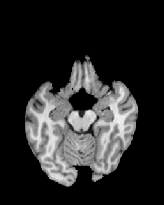
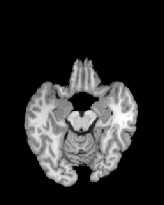
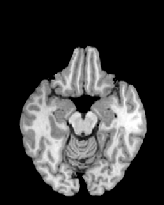
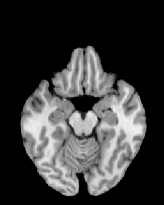
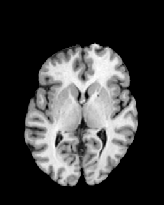
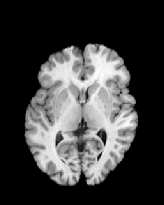
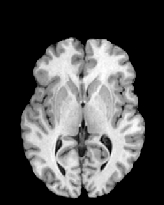
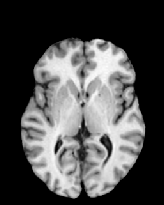
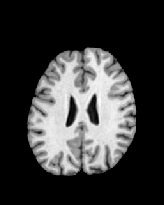
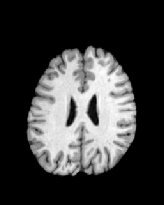
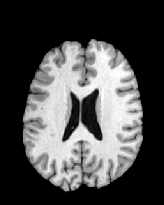
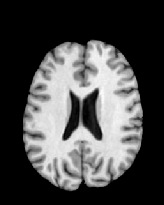
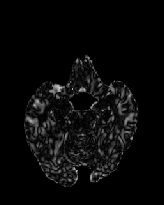
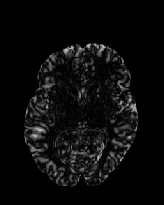
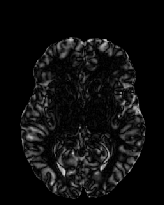
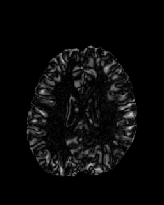
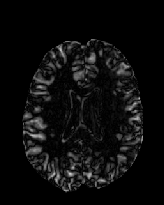
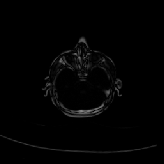
Figure 6 shows three transverse
sections from the 3D result from the template ![]() , deformed target
, deformed target ![]() , target
, target ![]() , deformed template
, deformed template ![]() MRI data sets. The first two columns and the last two columns
should look a like for a good registration. These pairs of columns look
similar with respect to the global structures but have small local differences
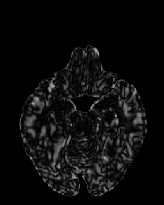
as seen by the difference images shown in the first two columns of Fig. 7.
Notice that the outer contour of the deformed images match their respective
target data sets and that there is good correspondence in the region of
the ventricles. The local mismatch is mostly due to differences in the
topology of the gray matter folds and due to the low-frequency Fourier
series parameterization of the transformations.
MRI data sets. The first two columns and the last two columns
should look a like for a good registration. These pairs of columns look
similar with respect to the global structures but have small local differences
as seen by the difference images shown in the first two columns of Fig. 7.
Notice that the outer contour of the deformed images match their respective
target data sets and that there is good correspondence in the region of
the ventricles. The local mismatch is mostly due to differences in the
topology of the gray matter folds and due to the low-frequency Fourier
series parameterization of the transformations.
|
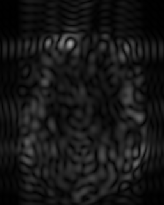
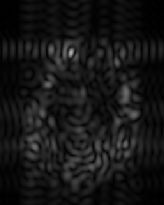
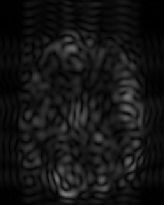
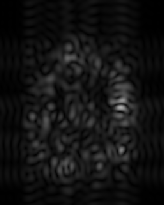
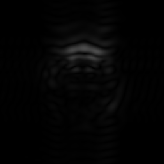
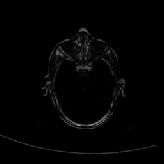
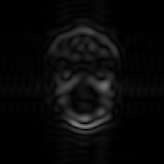
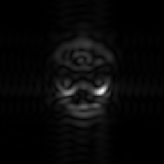
The last two columns of Fig. 7 shows the normed difference between the forward and reverse transformations for the MRI-to-MRI experiment. These figures show the spatial locations of where the forward and reverse transformations have the largest inverse consistency errors. The range on the the difference for the entire 3D volume is from 0 to 0.002234. This maximum difference corresponds to a registration error between 0.571 and 0.749 voxel units6. Notice that most of the error is internal to the brain and that most of the error appears in the cortex regions. The similarities between the absolute difference intensity images to the normed transformation difference images suggest that most of the inverse consistency error occurs were the transformed images are still mismatched. A further description and additional figures showing the effect of using or not using the inverse consistency cost as it relates to the spatial inverse consistency error can be found in [31].
|
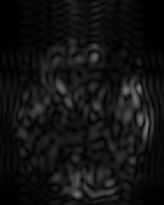
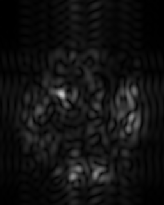
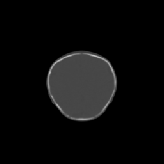
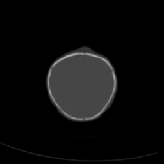
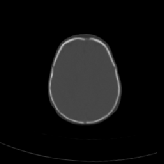
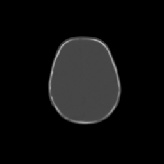
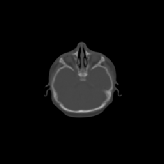
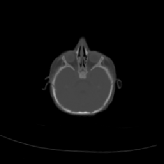
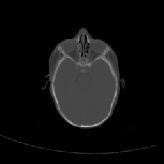
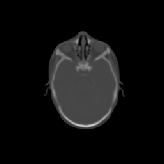
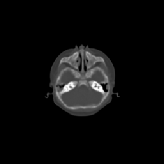
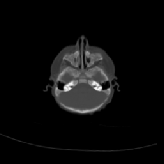
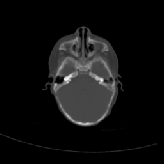
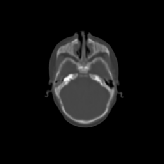
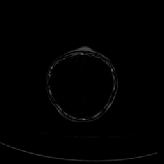
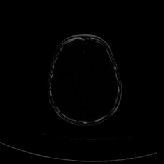
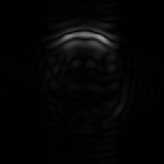
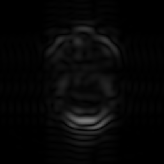
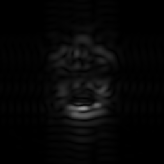
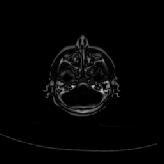
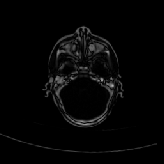
Three transverse slices from the 3D full resolution CT-to-CT experiment are shown in Fig. 8. Notice the good global registration of the corresponding CT data sets. The first two columns of Fig. 9 shows the absolute intensity difference between these slices. As before, the errors show up along the boundaries of the objects. The last two columns of this figure show the normed difference between the forward and reverse transformations. Again we see similarities between the intensity differences and the transformation differences. The maximum inverse consistency error for this experiment is between 0.871 and 1.16 voxel units7.
|
|
The MRI-to-MRI registration following the schedule in Table 3
took approximately 4, 40, 60, and 55 minutes to compute at the
![]() ,
,
![]() ,
,
![]() , and
, and
![]() voxel resolutions, respectively. The CT-to-CT
registration took approximately 2, 21, 33, and 30 minutes to compute at
the
voxel resolutions, respectively. The CT-to-CT
registration took approximately 2, 21, 33, and 30 minutes to compute at
the
![]() ,
,
![]() ,
,
![]() , and
, and
![]() voxel resolutions, respectively. All times
are for an AlphaPC clone using a single 667 MHz, alpha 21264 processor.
voxel resolutions, respectively. All times
are for an AlphaPC clone using a single 667 MHz, alpha 21264 processor.
Next: Discussion Up: Results Previous: Parameter Evaluation Xiujuan Geng 2002-07-04
Copyright © 2002 • The University of Iowa. All rights reserved.
Iowa City, Iowa 52242
Questions or Comments: gary-christensen@uiowa.edu