HW 7 Excel, Word and Engineering EconomicsDue date 4:30 pm FRIDAY October 6. This homework is to be done INDIVIDUALLY (teams will be used later in the semester) starting with an empty file. Make sure that you do not use a modified file from another student, since the file characteristics will be checked. Include your name at the top of each file submitted. A. Create an Excel file with - A Gantt chart . Choose an activity (such as a wedding, getting a job, going on vacation) that will involve 5 or more non-sequential steps. Show the planned activities in a Gantt chart in Excel, similar to the Gantt chart demonstrated in class. Use weeks as the cell time unit.
- An economic analysis. Select values for a project with the initial cost (somewhere in the range $50,000 to $5,000,000) in year 0 and subsequent returns in years 1 to 5. Use the inbuilt functions in Excel to calculate the present value (using NPV) and the internal rate of return (using IRR)
- A chart using the data in 2. above in histogram format. Change the default color, background.

B. Create a Word file with the following - Several headings using Heading 1 and Heading 2 styles
- A small amount of text using the normal style
- Modify the normal style to font Arial 10 (Format | Styles and Formatting)
- Copy and paste (as Excel objects) the Gantt chart from A.1 above, and the chart from A.3 above. Use Edit | Paste Special to make sure that you paste Excel objects.
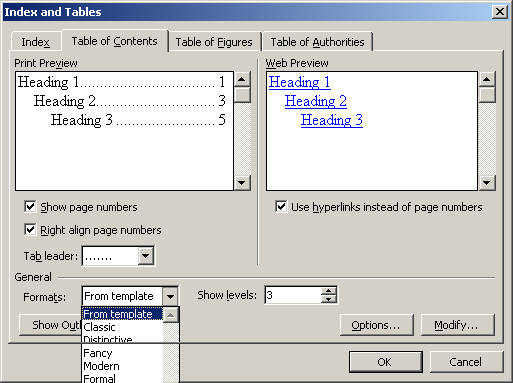
- Insert an automatic table of contents (use Insert | Reference | Index and Tables | Table of Contents) You can select some more fancy formats (such as Classic, Distinctive etc) for the table of contents as shown.
E-mail the Word AND Excel documents as attachments to a single e-mail by 5:30 pm FRIDAY October 6 to the class e-mail account eng_0056@engineering.uiowa.edu . Make sure that you use your name in the file names. (Late fees apply. Do check that the files are attached.) |
