55:148 Digital Image Processing
Chapter 2, Part II
Digitized image and its properties: Image digitization
Related Reading
Sections from Chapter 2 according to the WWW Syllabus.
Chapter 2.2 Overview:
Image digitization
- An image captured by a sensor is expressed as a continuous function f(x,y) of two
co-ordinates in the plane.
- Image digitization means that the function f(x,y) is sampled into a matrix with M
rows and N columns.
- The image quantitation assigns to each continuous sample an integer value.
- The continuous range of the image function f(x,y) is split into K intervals.
- The finer the sampling (i.e., the larger M and N) and quantitation (the larger K) the
better the approximation of the continuous image function f(x,y).
- Two questions should be answered in connection with image function sampling:
- First, the sampling period should be determined -- the distance between two neighboring
sampling points in the image
- Second, the geometric arrangement of sampling points (sampling grid) should be set.
Sampling
- A continuous image function f(x,y) can be sampled using a discrete grid of sampling
points in the plane.
- The image is sampled at points x = j ( Delta_x), y = k (Delta_y)
- Two neighboring sampling points are separated by distance Delta_x along the x axis and
Delta_y along the y axis. Distances Delta_x and Delta_y are called the sampling
interval and the matrix of samples constitutes the discrete image.
- The ideal sampling s(x,y) in the regular grid can be represented using a collection of
Dirac distributions (Eq. 2.31)

- The sampled image is the product of the continuous image f(x,y) and the sampling
function s(x,y) (Eq. 2.32)

- The collection of Dirac distributions in equation 2.32 can be regarded as periodic with
period x, y and expanded into a Fourier series (assuming that the sampling grid covers the
whole plane (infinite limits)). (Eq. 2.33)

where the coefficients of the Fourier expansion can be calculated as
given in Eq. 2.34

- Noting that only the term for j=0 and k=0 in the sum is nonzero in the range of
integration, the coefficients are in Eq. 2.35

- Noting that the integral in equation 2.35 is uniformly equal to one the coefficients can
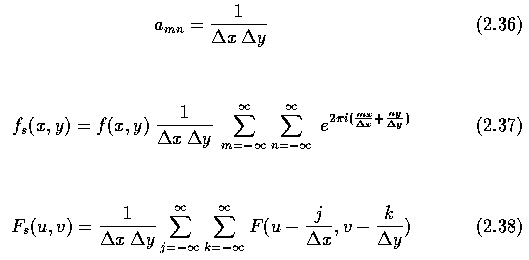
be expressed as given in Eq. 2.36 and 2.32 can be rewritten as Eq. 2.37.
- In frequency domain then Eq. 2.38.

- Thus the Fourier transform of the sampled image is the sum of periodically repeated
Fourier transforms F(u,v) of the image.
- Periodic repetition of the Fourier transform result F(u,v) may under certain conditions
cause distortion of the image which is called aliasing; this happens when
individual digitized components F(u,v) overlap.
- There is no aliasing if the image function f(x,y) has a band limited spectrum ... its
Fourier transform F(u,v)=0 outside a certain interval of frequencies |u| > U; |v| >
V.
- As you know from general sampling theory, overlapping of the periodically repeated
results of the Fourier transform F(u,v) of an image with band limited spectrum can be
prevented if the sampling interval is chosen according to Eq. 2.39

- This is the Shannon sampling theorem that has a simple physical interpretation in
image analysis: The sampling interval should be chosen in size such that it is less than
or equal to half of the smallest interesting detail in the image.
- The sampling function is not the Dirac distribution in real digitizers -- narrow
impulses with limited amplitude are used instead.
- As a result, in real image digitizers a sampling interval about ten times smaller than
that indicated by the Shannon sampling theorem is used - because the algorithms for image
reconstruction use only a step function.
- Practical examples of digitization using a flatbed scanner and TV cameras help to
understand the reality of sampling.
Practical Experiments
The following web sites explore the concept of aliasing in images.
Practical Experiment 2.B - VIP Version
- not available at this time - instead, examine the following cases which represent the
concepts of sampling and resampling:
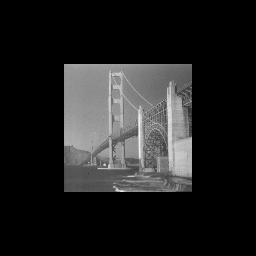
| Original image of Golden Gate Bridge: |

|
|
|
| Image resampled at half the original resolution: |
|
With image size adjusted: |

|
Without image size adjusted: |

|
| Image resampled at twice the original resolution: |
|
With image size adjusted: |

|
Without image size adjusted: |

|
|
|
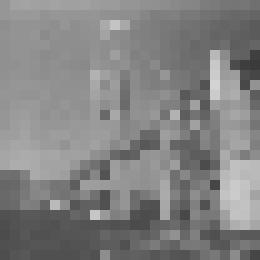
| Image which has been downsampled at one-tenth resolution, and upsampled at
10x resolution: |

|
Practical Experiment 2.B - Khoros Version
- Now, it's time for some exploration and you have 5 minutes for that.
- Using the histogram workspace, add a Resample glyph to your workspace (you
will find it in Glyphs->Data Manipulation->Size & Region
Operators->Resample). Connect its output to a Display glyph. Modifying the Width
and Height factors, resample the image using pixel replication. Be careful if you are
using the YES option in resize dimensions, the image may become quite large.
Note the pixel size changes.
- You are ready for more advanced investigation. Add one more Resample glyph in
series with the first one. Using YES option in resize dimensionsÓ, decrease the image
resolution to 1/n in the first resampling and subsequently increase n times. Do you see
the effect of decreasing image resolution on image quality?
- A continuous image is digitized at sampling points.
- These sampling points are ordered in the plane and their geometric relation is called
the grid.
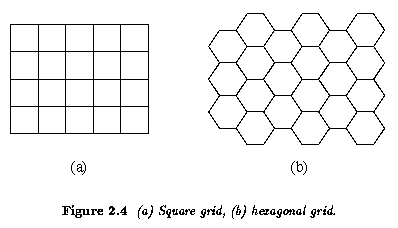
- Grids used in practice are mainly square or hexagonal (Figure 2.4).

- One infinitely small sampling point in the grid corresponds to one picture element (pixel)
in the digital image.
- The set of pixels together covers the entire image.
- Pixels captured by a real digitization device have finite sizes.
- The pixel is a unit which is not further divisible, sometimes pixels are also called
points.
Quantization
- A magnitude of the sampled image is expressed as a digital value in image processing.
- The transition between continuous values of the image function (brightness) and its
digital equivalent is called quantitation.
- The number of quantitation levels should be high enough for human perception of fine
shading details in the image.
- Most digital image processing devices use quantitation into k equal intervals.
- If b bits are used ... the number of brightness levels is k=2b.
- Eight bits per pixel are commonly used, specialized measuring devices use twelve and
more bits per pixel.
Color images
[Back one section]
[Table of Contents]
[Next Section]
Last Modified: September 8, 2003
![[Go Back]](../IMAGES/next.gif)


