
|
[Home]
|
[Grades]
|
[Handouts]
|
Precipitation Measurement
(Portions adapted from Smith, 1993)
Gages
A variety of gages are used to measure precipitation at the ground surface. Rain gages are of two types: recording and non-recording. A recording gage automatically records rainfall accumulation at temporal resolutions down to 1 minute or less. Recording rain gages are often equipped with telemetry to allow for real-time transmission and utilization for water management.Major types of recording rain gages are:
- weighting
- float and siphon
- tipping-bucket
- optical
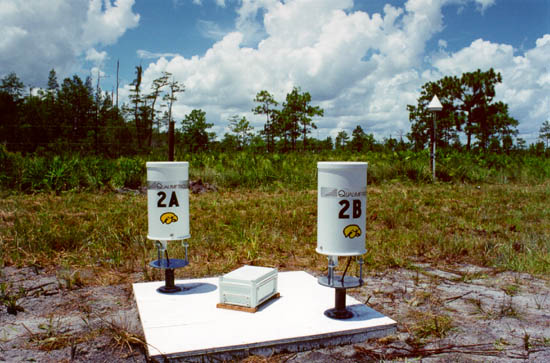
Tipping-Bucket Recording Rain Gage This shows a pair of tipping-bucket rain gages constructed at the Iowa Institute of Hydraulic Research (IIHR) for use in rainfall research. These gages were deployed in central Florida as part of the NASA Tropical Rainfall Measurement Mission (TRMM) TEFLUN-B experiment. Similar gage pairs have installed at the Iowa City Aiport at several locations to study small-scale rainfall variability. |
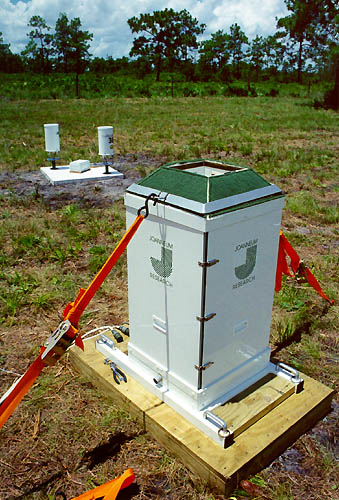
This is an 2-D optical disdrometer, which measures the characteristics of rain drops. The video disdrometer is able to detect the size and shape of each drop as it passes the sensor opening. This information can be used to estimate the rainfall and other variables, such as the rain drop size distributions and the radar reflectivity factor (Z). Examples are available from the TEFLUN-B experiments in Florida in August, 1998. |
Nonrecording gages consist simply of a cylindrical container and a calibrated measuring stick, which may be a part of the gage. Primative rain gages were used in several cultures more than 2000 years ago. The invention of the "modern" nonrecording gage is attributed to the Koreans and dates back to the sixteenth century.
Gage Undercatch
Virtually all rain gages suffer from errors due to the modification of the wind field by the gage. Ongoing research at the IIHR--Hydroscience & Engineering is being carried out by Prof. Witold Krajewski and Emad Habib to examine this effect. Computational fluid dynamics (CFD) is used to simulate the wind flow field for around the rain gage. An example is shown for the optical disdrometer described above.
This figure illustrates the computational grid utilized in the CFD simulations. A variable grid size with finer resolution near the disdrometer was employed. |
This figure shows streamlines and velocity contours in the vicinity of the disdrometer for a uniform upstream wind velocity of 1 m/s. The top figure shows the velocities in the horizontal direction (u-component). The bottom figure shows velocities in the vertical direction (v-component). |
The magnitude of errors in gage measurements depends heavily on wind speed, siting characteristics, type of precipitation (rain or snow), and temperature. Errors are generally in the form of catch deficiences (i.e., less precipitation is measured than actually occurs). Measurement errors for snow are typically much larger than for rain.
Radar
The most important advantage of using radar for precipitation measurement is the coverage radar provides of a large area with high spatial and temporal resolution. Radar can provide rainfall estimates for time intervals as small as 5 minutes and spatial resolution as small as 1 km^2. With an effective range of approximately 200 km (130 mi), a single radar can cover an area of more than 10,000 km^2 (4500 mi^2).In the United States, a network of more than 120 high-quality radars, the Next Generation Weather Radar system (NEXRAD), has been deployed. The first NEXRAD unit, which is located in Oklahoma City, began operation in 1991. The NEXRAD systems are termed WSR-88D (Weather Surveillence Radar - 1988 Doppler). Some links to sites with information and images on the NEXRAD system and WSR-88D radars are listed below.
- WSR-88D Doppler Radar (FAQ)
- Latest Davenport (DVN) NEXRAD Reflectivity Image
- Latest National NEXRAD Reflectivity Image
- Latest Davenport (DVN) NEXRAD Storm Accumulation
- National Hourly Precipitation Analysis
- NEXRAD National Reflectivity (Z) Images (Archive)
- Heavy Rain near Chicago (16-18 July 1996) seen from Davenport WSR-88D
- Severe Storm with High Winds and Local Flooding (29 June 1998)
Satellite
Satellite sensors provide the only systematic means of measuring rainfall over three quarters of the earth --- the region covered by oceans. Satellite systems are the principal source of information for long-term assessment of trends in precipitation associated with global climate change. Major satellite monitoring programs for rainfall include the Global Precipitation Climatology Project (GPCP) and the NASA Tropical Rainfall Measurement Mission (TRMM). Some links to satellite precipitation products for the National Oceanic and Atmospheric Administration (NOAA) are listed below.- NOAA/NESDIS Experimental Products for Flash Flood Forecasting
- Satellite Precipitation Estimation by the NOAA Satellite Services Division
References
Smith, J. A., 1993. Precipitation. Handbook of Hydrology, D. R. Maidment, Editor, McGraw-Hill.Last changed on 01/26/04 by aab.