
Research Interests
Medical computer vision and graphics, machine learning & deep learning, pattern recognition, lung image analysis, robust model-based segmentation methods, efficient interactive segmentation methods, PET image analysis, and computer-aided surgical planning.
- Deep learning for medical image segmentation and analysis
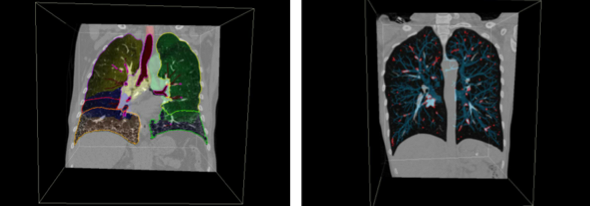
Segmentation of PET and CT volumes using 3D convolutional neural networks (CNNs). An example for 3D lung segmentation in CT scans is given below.
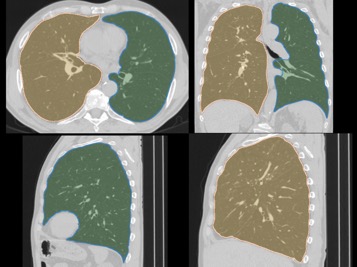
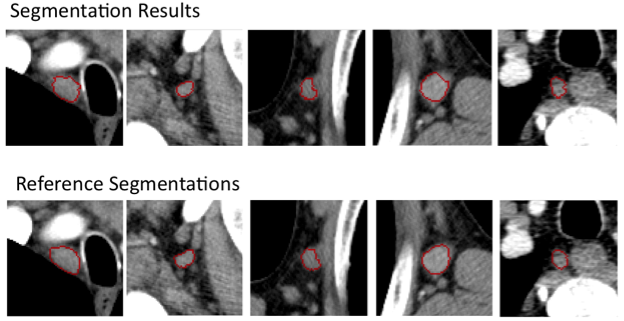
Comparison of CNN-based lung segmentation with corresponding ground truth. The shaded portions are the CNN predicted segmentations and the outlines are the reference segmentations.
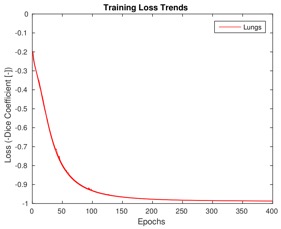
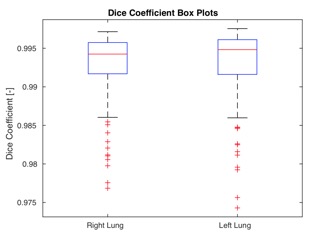
Training loss trends on lung CT data and Dice coefficient box plots on the test set after 400 training epochs.
- FDG/FLT PET-CT based outcome prediction for head and neck cancer (HNC) treatment
We have rich experience in quantitative imaging biomarker (QIB) discovery and predictive modeling. For example, several novel QIBs have been identified for HNC treatment outcome prediction that outperform commonly used tracer uptake indices like SUVmax, total lesion glycolysis (TLG), or metabolic tumor volume (MTV).
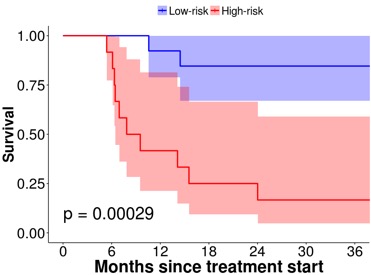
Example of a highly predictive FDG PET based QIB for outcome prediction in HNC treatment.
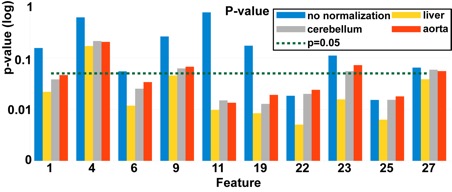
Example of investigated FDG QIBs and their predictive power. For each QIB, different normalization options were investigated. Many of the normalized features perform better (small p-value and large CV AUC) than their un-normalized counterparts.
- To facilitate quantitative analysis of FDG PET scans in clinical trials, we have developed a number of open source software (extensions) for 3D Slicer.


Please see our QIN project website for more details (NIH projects U01 CA140206 and U24 CA180918).
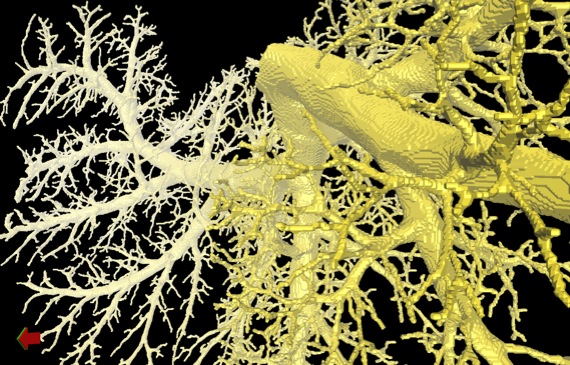
-Anatomically derived airway models to facilitate computational toxicology in mice
Computer simulations of particle deposition in mouse lungs play an important role in computational toxicology. Up to now, a limiting factor was the lack of high-resolution mouse lung models combined with measured local particle deposition information, which are required for developing accurate modeling approaches (e.g., computational fluid dynamics). With the by NIH project R01 ES023863 developed imaging and analysis approach we have addressed this issue. Analysis resulted in 34 mouse models, covering four different mouse strains (B6C3F1: 8, BALB/C: 11, C57Bl/6: 8, and CD-1: 7) as well as both sexes (male: 16 and female: 18) and different particle sizes (2 μm: 15, 1 μm: 16, and 0.5 μm: 3). On average resulting mouse airway models had 1616.9±298.1 segments, a centerline length of 597.6±59.8 mm, and 1968.9±296.3 outlet regions. In addition to 3D geometric lung models, matching detailed relative particle deposition measurements are provided. All data sets are available online in the lapdMouse archive for download (https://doi.org/10.25820/9arg-9w56). The presented approach enables linking relative particle deposition to anatomical structures like airways. This will in turn improve the understanding of site-specific airflows and how they affect drug, environmental, or biological aerosol deposition.
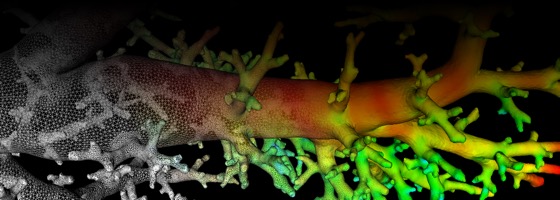
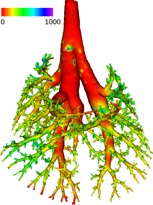
Examples showing the anatomical structure of mouse airways combined with particle deposition measurements.
- Automated Model-Based Quantitative Analysis of FDG PET Phantoms
Quality control plays an increasingly important role in quantitative PET imaging and is typically performed using phantoms. To simplify the quantitative analysis process, we have developed automated algorithms for four commonly utilized PET/CT quality assurance phantoms.
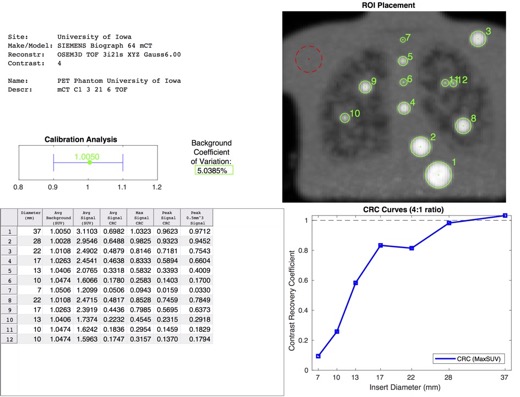
Example of an automatically generated PET phantom analysis report.
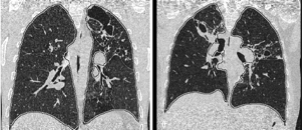
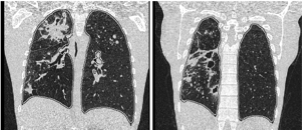
- Lung Image Segmentation
Robust Active Shape Model (RASM) based segmentation of lungs with high density pathology.
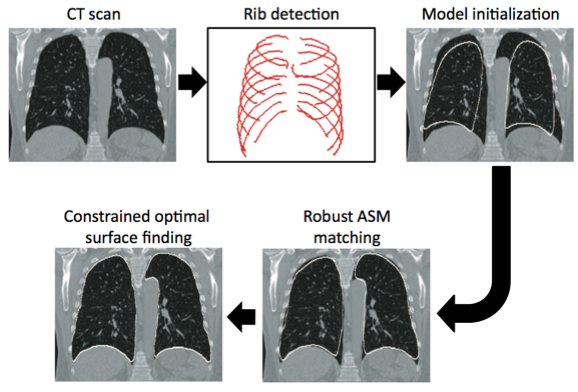
Example of segmentation results.
Automated Airway Segmentation and Analysis.
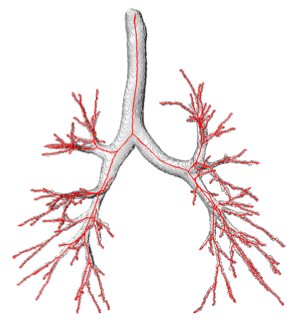
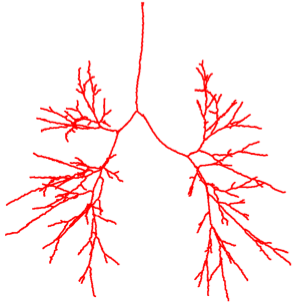
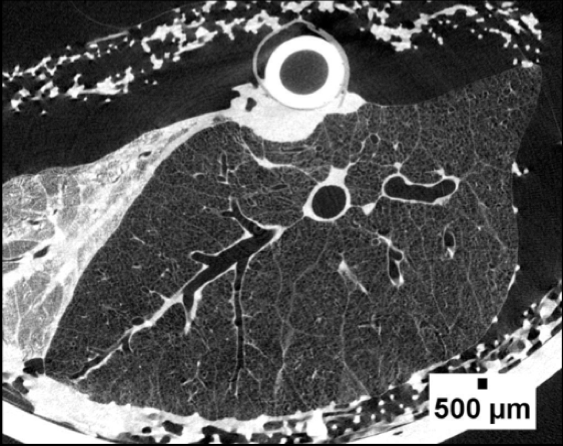
- Segmentation and Analysis of Cystic Fibrosis (CF) Piglet Airways in Micro-CT Image Data
Highly-automated methods were developed to obtain detailed structural models of airway trees from ex-vivo porcine lung tissue imaged with a high resolution micro-CT scanner. Such information is an important prerequisite to systematically study models of lung disease that affect airway morphology (e.g., CF).
Collaborator: David A. Stoltz, Dept. of Internal Medicine, The University of Iowa.
Micro-CT image of a porcine lung.
Digital airway tree model derived from an ex-vivo micro-CT scan.
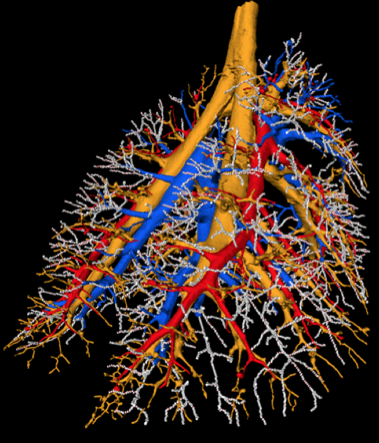
- Computer-aided Analysis of Mechanisms Matching Ventilation and Perfusion
In this project advanced computer-aided analysis methods are developed to explore the mechanism responsible for efficient gas exchange in lungs.
Collaborator: Robb Glenny, M.D., University of Washington
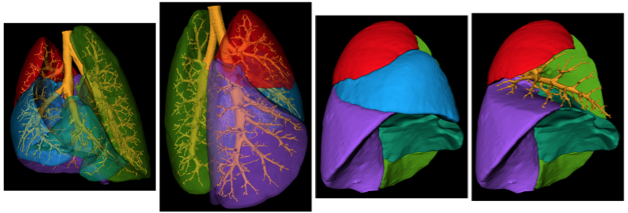
Rat airway tree and pulmonary vessels derived from multi-spectral cryomicrotome images of rat lungs.
Rat airway tree and lung lobes.
- PET Image Analysis
Computer‐aided quantitative analysis of PET/CT scans of head and neck cancer patients to facilitate prediction of treatment outcome. This project is part of the Quantitative Imaging Network (QIN) funded by the “Quantitative Imaging for Evaluation of Responses to Cancer Therapies” (U01) (PAR‐11‐150) mechanism.
Collaborators/PIs: J. Buatti, T. Casavant, M. Graham, and M. Sonka, The University of Iowa.
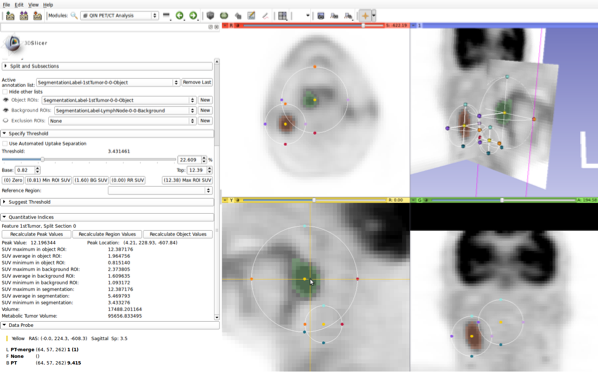
To facilitate quantitative analysis of FDG PET scans in clinical trials, we have developed open source software (extensions) for 3D Slicer. An overview of available software, short introductory videos, and links to source code available on github can be found at qin.iibi.uiowa.edu.
Interactive approach for uptake quantification in PET images (integrated into 3D Slicer).
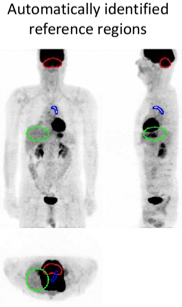
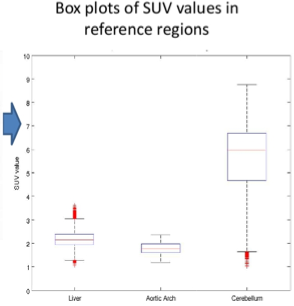
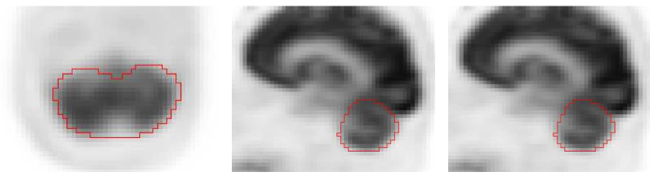
Fully automated segmentation of reference regions (cerebellum, aortic arch, and liver) in PET/CT scans for normalization of uptake.
Example of cerebellum segmentation in PET image data.
- Intravascular Ultrasound Image Segmentation
Graph-based approach for segmentation of luminal and external elastic lamina (EEL) surface of coronary vessels in intravascular ultrasound (IVUS) image sequences (volumes). The approach consists of a fully automated segmentation stage (‘new automated’ or NA) and a user-guided computer-aided refinement (‘new refinement’ or NR) stage.
Collaborator: M. Sonka, The University of Iowa.
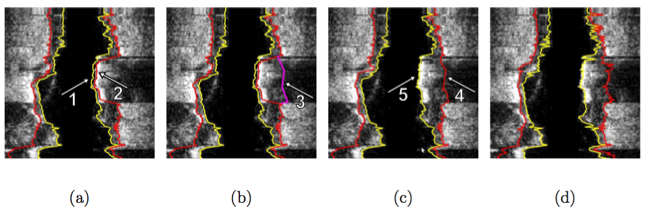
Illustration of interactive segmentation refinement of an automatically generated IVUS segmentation. (a) The user inspects the IVUS segmentation produced by the automated approach and discovers a local segmentation inaccuracy of the inner (arrow 1) and outer (arrow 2) surface. The outer boundary segmentation got “distracted” by a high density (calcified) region inside of the vessel wall and the associated shadow. (b) The user roughly indicates the correct location of the outer wall by drawing a polygon line (arrow 3, purple line) in proximity to the desired surface location. This single polygon line is used to locally modify the cost function for the outer boundary. (c) Refinement result after “recalculating” the segmentation result. Note that outer (arrow 4) and inner boundary (arrow 5) are simultaneously corrected due to the mutually interacting dual-surface segmentation approach. (d) Corresponding independent standard.
- Medical Virtual Reality
Interactive exploration of medical image data in a virtual reality (VR) environment.
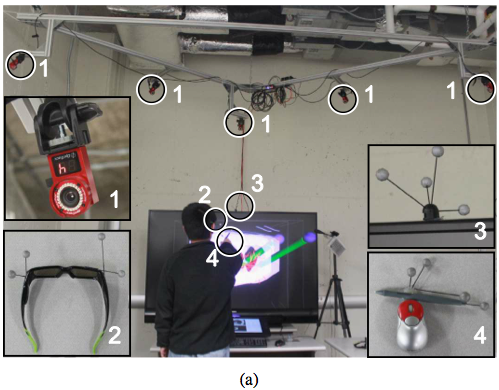
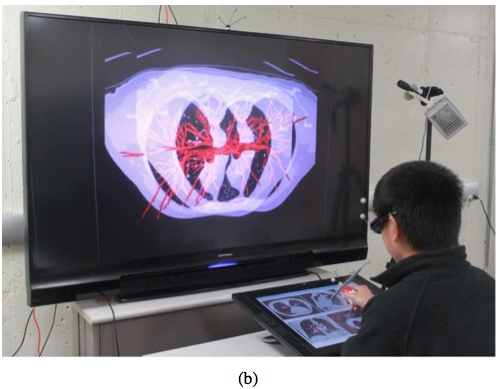
VR setup - Hybrid user interface for interactive visualization and manipulation of medical image data and corresponding segmentations. (a) The user inspects the segmentation result by utilizing a 3D user interface. Circled devices are shown in enlarged sub-figures: (1) tracking cameras, (2) shutter glasses with head tracking targets, (3) stereo display with tracking targets, and (4) tracked input device. (b) The user operates the 2D user interface.
Advanced interactive visualization methods utilizing general-purpose computing on graphics processing units (GPGPU).
Example of interactive segmentation refinement - a real-time “dialog” between segmentation algorithm and user. Segmentation refinement of a lung with a small lung mass adjacent to the lung boundary. (a) The user inspects the lung segmentation and locates a segmentation error. (b) In a cross-section, the user selects a point on the correct boundary location with a virtual pen. Note that the incorrect portion of the contour is highlighted in light blue, which was automatically generated based on the selected point. (c) and (d) Refinement result after calculating the updated segmentation. (d) The corrected surface region is highlighted in green.
- Lymph Node Segmentation in CT Data
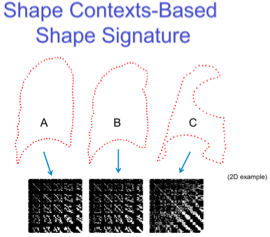
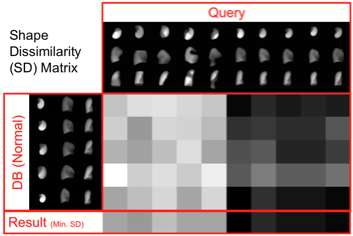
- Lung Shape Analysis
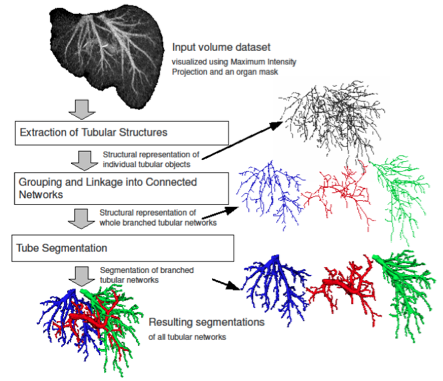
- Automated Analysis and Separation of Vascular Structures
- Projects @ Graz University of Technology
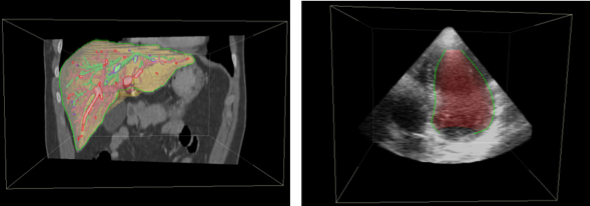
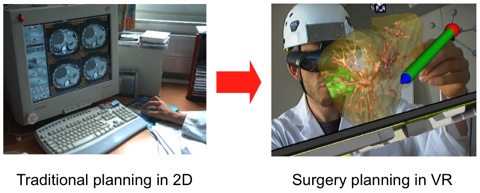
A novel approach to liver surgery planning.
Medical computer vision and graphics, machine learning & deep learning, pattern recognition, lung image analysis, robust model-based segmentation methods, efficient interactive segmentation methods, PET image analysis, and computer-aided surgical planning.
- Deep learning for medical image segmentation and analysis
Segmentation of PET and CT volumes using 3D convolutional neural networks (CNNs). An example for 3D lung segmentation in CT scans is given below.
Comparison of CNN-based lung segmentation with corresponding ground truth. The shaded portions are the CNN predicted segmentations and the outlines are the reference segmentations.
Training loss trends on lung CT data and Dice coefficient box plots on the test set after 400 training epochs.
- FDG/FLT PET-CT based outcome prediction for head and neck cancer (HNC) treatment
We have rich experience in quantitative imaging biomarker (QIB) discovery and predictive modeling. For example, several novel QIBs have been identified for HNC treatment outcome prediction that outperform commonly used tracer uptake indices like SUVmax, total lesion glycolysis (TLG), or metabolic tumor volume (MTV).
Example of a highly predictive FDG PET based QIB for outcome prediction in HNC treatment.
Example of investigated FDG QIBs and their predictive power. For each QIB, different normalization options were investigated. Many of the normalized features perform better (small p-value and large CV AUC) than their un-normalized counterparts.
- To facilitate quantitative analysis of FDG PET scans in clinical trials, we have developed a number of open source software (extensions) for 3D Slicer.
Please see our QIN project website for more details (NIH projects U01 CA140206 and U24 CA180918).
-Anatomically derived airway models to facilitate computational toxicology in mice
Computer simulations of particle deposition in mouse lungs play an important role in computational toxicology. Up to now, a limiting factor was the lack of high-resolution mouse lung models combined with measured local particle deposition information, which are required for developing accurate modeling approaches (e.g., computational fluid dynamics). With the by NIH project R01 ES023863 developed imaging and analysis approach we have addressed this issue. Analysis resulted in 34 mouse models, covering four different mouse strains (B6C3F1: 8, BALB/C: 11, C57Bl/6: 8, and CD-1: 7) as well as both sexes (male: 16 and female: 18) and different particle sizes (2 μm: 15, 1 μm: 16, and 0.5 μm: 3). On average resulting mouse airway models had 1616.9±298.1 segments, a centerline length of 597.6±59.8 mm, and 1968.9±296.3 outlet regions. In addition to 3D geometric lung models, matching detailed relative particle deposition measurements are provided. All data sets are available online in the lapdMouse archive for download (https://doi.org/10.25820/9arg-9w56). The presented approach enables linking relative particle deposition to anatomical structures like airways. This will in turn improve the understanding of site-specific airflows and how they affect drug, environmental, or biological aerosol deposition.
Examples showing the anatomical structure of mouse airways combined with particle deposition measurements.
- Automated Model-Based Quantitative Analysis of FDG PET Phantoms
Quality control plays an increasingly important role in quantitative PET imaging and is typically performed using phantoms. To simplify the quantitative analysis process, we have developed automated algorithms for four commonly utilized PET/CT quality assurance phantoms.
Example of an automatically generated PET phantom analysis report.
- Lung Image Segmentation
Robust Active Shape Model (RASM) based segmentation of lungs with high density pathology.
Example of segmentation results.
Automated Airway Segmentation and Analysis.
- Segmentation and Analysis of Cystic Fibrosis (CF) Piglet Airways in Micro-CT Image Data
Highly-automated methods were developed to obtain detailed structural models of airway trees from ex-vivo porcine lung tissue imaged with a high resolution micro-CT scanner. Such information is an important prerequisite to systematically study models of lung disease that affect airway morphology (e.g., CF).
Collaborator: David A. Stoltz, Dept. of Internal Medicine, The University of Iowa.
Micro-CT image of a porcine lung.
Digital airway tree model derived from an ex-vivo micro-CT scan.
- Computer-aided Analysis of Mechanisms Matching Ventilation and Perfusion
In this project advanced computer-aided analysis methods are developed to explore the mechanism responsible for efficient gas exchange in lungs.
Collaborator: Robb Glenny, M.D., University of Washington
Rat airway tree and pulmonary vessels derived from multi-spectral cryomicrotome images of rat lungs.
Rat airway tree and lung lobes.
- PET Image Analysis
Computer‐aided quantitative analysis of PET/CT scans of head and neck cancer patients to facilitate prediction of treatment outcome. This project is part of the Quantitative Imaging Network (QIN) funded by the “Quantitative Imaging for Evaluation of Responses to Cancer Therapies” (U01) (PAR‐11‐150) mechanism.
Collaborators/PIs: J. Buatti, T. Casavant, M. Graham, and M. Sonka, The University of Iowa.
To facilitate quantitative analysis of FDG PET scans in clinical trials, we have developed open source software (extensions) for 3D Slicer. An overview of available software, short introductory videos, and links to source code available on github can be found at qin.iibi.uiowa.edu.
Interactive approach for uptake quantification in PET images (integrated into 3D Slicer).
Fully automated segmentation of reference regions (cerebellum, aortic arch, and liver) in PET/CT scans for normalization of uptake.
Example of cerebellum segmentation in PET image data.
- Intravascular Ultrasound Image Segmentation
Graph-based approach for segmentation of luminal and external elastic lamina (EEL) surface of coronary vessels in intravascular ultrasound (IVUS) image sequences (volumes). The approach consists of a fully automated segmentation stage (‘new automated’ or NA) and a user-guided computer-aided refinement (‘new refinement’ or NR) stage.
Collaborator: M. Sonka, The University of Iowa.
Illustration of interactive segmentation refinement of an automatically generated IVUS segmentation. (a) The user inspects the IVUS segmentation produced by the automated approach and discovers a local segmentation inaccuracy of the inner (arrow 1) and outer (arrow 2) surface. The outer boundary segmentation got “distracted” by a high density (calcified) region inside of the vessel wall and the associated shadow. (b) The user roughly indicates the correct location of the outer wall by drawing a polygon line (arrow 3, purple line) in proximity to the desired surface location. This single polygon line is used to locally modify the cost function for the outer boundary. (c) Refinement result after “recalculating” the segmentation result. Note that outer (arrow 4) and inner boundary (arrow 5) are simultaneously corrected due to the mutually interacting dual-surface segmentation approach. (d) Corresponding independent standard.
- Medical Virtual Reality
Interactive exploration of medical image data in a virtual reality (VR) environment.
VR setup - Hybrid user interface for interactive visualization and manipulation of medical image data and corresponding segmentations. (a) The user inspects the segmentation result by utilizing a 3D user interface. Circled devices are shown in enlarged sub-figures: (1) tracking cameras, (2) shutter glasses with head tracking targets, (3) stereo display with tracking targets, and (4) tracked input device. (b) The user operates the 2D user interface.
Advanced interactive visualization methods utilizing general-purpose computing on graphics processing units (GPGPU).
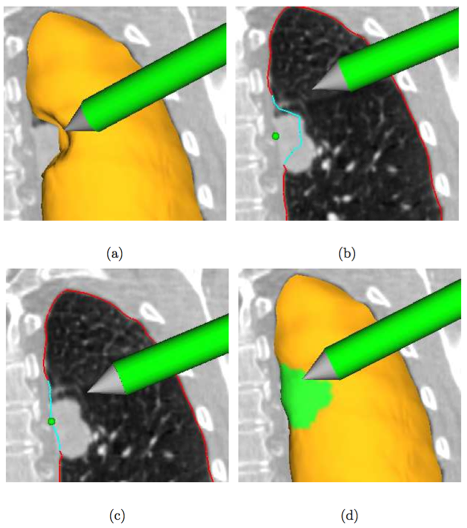
Example of interactive segmentation refinement - a real-time “dialog” between segmentation algorithm and user. Segmentation refinement of a lung with a small lung mass adjacent to the lung boundary. (a) The user inspects the lung segmentation and locates a segmentation error. (b) In a cross-section, the user selects a point on the correct boundary location with a virtual pen. Note that the incorrect portion of the contour is highlighted in light blue, which was automatically generated based on the selected point. (c) and (d) Refinement result after calculating the updated segmentation. (d) The corrected surface region is highlighted in green.
- Lymph Node Segmentation in CT Data
- Lung Shape Analysis
- Automated Analysis and Separation of Vascular Structures
- Projects @ Graz University of Technology
A novel approach to liver surgery planning.