Problem
Because of disorders, older drivers often have to cope with functional limitations, such as a delayed visual control on their motor system, which may result in diminished operational driving skills. One of these driving skills is steering performance. Because drivers are able to determine their driving speed, negative effects on safety may be counterbalanced by adequate speed choice, which is an example of a tactical driving skill. This gives them more time to process information. Poorer operational skills in older drivers do not necessarily pose a problem in terms of reduced traffic safety if the driver is aware of reduced operational skills and adapts driving speed accordingly. Based on this principle, we propose a standard simulator test to assess the fitness to drive for older drivers.
Operational driving skills may be difficult to examine in normal driving situations because in real-world driving, drivers are often able to pace the task demands by choosing a vehicle speed in accordance with their skill level. In order to assess the real driving skills, it is then important to remove the possibility of speed adaptation and force them to drive with a fixed speed. In this test, the effect of vehicle speed on steering performance is used, because steering performance can be measured continuously and easily in most simulators.
If drivers are aware of their poorer steering skills, effects on driver safety may be limited if the driver chooses to drive at a reduced speed. A second dimension in the present proposal then is speed adaptation: some groups of older drivers may differ in their awareness of poorer operational skill level and thus, in their ability to cope with poorer steering skills by reducing vehicle speed. Drivers who voluntarily choose a lower speed in accordance with poorer steering skills are assumed to be safer compared to drivers who do not reduce speed sufficiently.
The problem can then be represented as a two-dimensional space, where driver safety is the outcome of both operational skills and tactical skills.
Operational skill level
| Tactical skill level | Good | Poor |
|---|---|---|
| Good | 1 ++ | 2 +/- |
| Poor | 3 - | 4 -- |
Experimental Manipulations and Dependent Variables
When drivers are subjected to a higher vehicle speed, steering requires more effort to keep performance within acceptable limits. Steering effort may be measured by the standard deviation of steering wheel angle. It is then predicted that a higher vehicle speed results in a higher SD of steering wheel angle. At higher speeds, the steering task becomes more demanding and requires more steering effort to keep performance at an acceptable level. When steering skills are poorer, this results in deteriorated task performance at higher speed. Steering performance may be measured by SD of lateral position and number of times the lane boundary is exceeded. The predictions are then as follows:
1) Driving at higher speed results in increased SD of steering wheel angle
2) Drivers with poorer steering skills exhibit a stronger effect of vehicle speed on steering performance (SD of lateral position and crossing of lane boundary): the slope of SD lateral position as a function of speed is steeper.
As an experimental manipulation, fixed speed level is used: the drivers drive at fixed speed levels of 50, 60, 70, 80, 90, and 100 km/h. This manipulation is referred to as fixed paced driving.
In addition, the choice of a comfortable speed, followed by a speed that is as fast as possible while being just safe, is used as a self-paced driving manipulation to measure the extent to which the driver selects a speed in accordance with steering skills. This manipulation then is assumed to measure tactical skills.
Database
The database consists of a long stretch of 500 meter radius curves that alternate as in the following blocks:
1) curve to left: angle subtended of 20 degrees (length 174.53 m)
2) curve to right: angle subtended of 20 degrees (length 174.53 m)
3) curve to right: angle subtended of 20 degrees (length 174.53 m)
4) curve to left: angle subtended of 20 degrees (length 174.53 m)
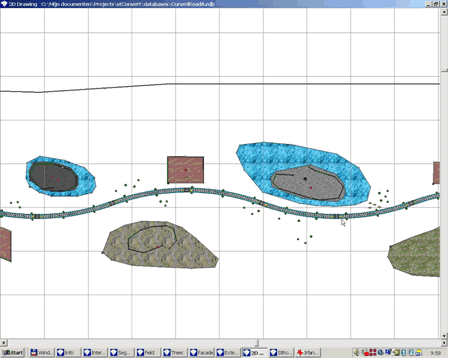
Each block then is approximately 700 meters long (Figure 1). There are 6 of these sequential blocks, marked 1 - 6 in the following discussion.

Figure 1. Six Sequential Blocks.
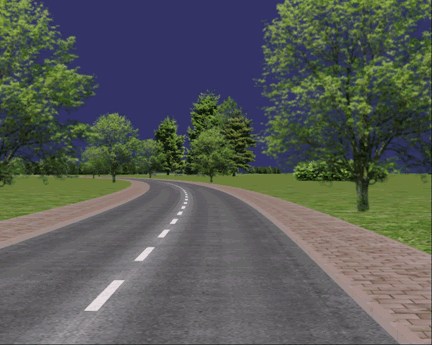
The road is a two-lane road. Lanes are divided by a discontinuous line. The lane width is 2.95 m. On both sides of the road is a pavement. Along the road are trees. The database has a rural landscape (Figure 2).

Figure 2. Perspective View of Scenario..
Scenarios
The driver is instructed to steer as accurately as possible and to avoid exceeding the lane boundary. In order to promote accurate steering, a constant stream of vehicles from the opposite direction is generated at an average rate of 20 vehicles per minute: on average, a vehicle is encountered every 3 seconds (range from 1 - 5 s).
The following driving scenarios are used:
Forced paced driving: the vehicle accelerates automatically from 0 to 50 km/h. After some time it accelerates to a speed that is 10 km/h higher and maintains that speed for about 700 meters:
1) curve to left: angle subtended of 20 degrees (length 174.53 m)
2) curve to right: angle subtended of 20 degrees (length 174.53 m)
3) curve to right: angle subtended of 20 degrees (length 174.53 m)
4) curve to left: angle subtended of 20 degrees (length 174.53 m)
Each block then is approximately 700 meters long (Figure 1). There are 6 of these sequential blocks, marked 1 - 6 in the following discussion.

Figure 1. Six Sequential Blocks.
The road is a two-lane road. Lanes are divided by a discontinuous line. The lane width is 2.95 m. On both sides of the road is a pavement. Along the road are trees. The database has a rural landscape (Figure 2).

Figure 2. Perspective View of Scenario..
Scenarios
The driver is instructed to steer as accurately as possible and to avoid exceeding the lane boundary. In order to promote accurate steering, a constant stream of vehicles from the opposite direction is generated at an average rate of 20 vehicles per minute: on average, a vehicle is encountered every 3 seconds (range from 1 - 5 s).
The following driving scenarios are used:
Forced paced driving: the vehicle accelerates automatically from 0 to 50 km/h. After some time it accelerates to a speed that is 10 km/h higher and maintains that speed for about 700 meters:
Forced paced driving: the vehicle accelerates automatically from 0 to 50 km/h. After some time it accelerates to a speed that is 10 km/h higher and maintains that speed for about 700 meters:
If the subject feels that task demands are too high, the trial can be stopped at any time by pressing the brake pedal. Self paced driving: the driver controls speed by using the accelerator, brake and clutch pedal. During the first three blocks the driver is instructed to choose a speed that is comfortable. During the second three blocks the driver is instructed to drive as fast as possible while still driving safely. During these blocks the following variables are measured:

