Intersection Incursion
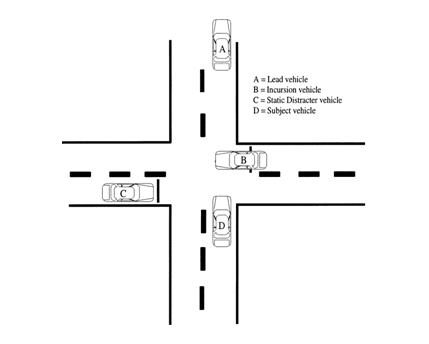
Each subject drives several miles on a simulated rural two-lane highway with interactive traffic. The scenario culminates with the driver's approach to an intersection, which triggers an illegal incursion by another vehicle (Figure 1). The spacing of generic oncoming traffic can be varied to constrain passing, if necessary. The speed limit is 55 miles per hour (mph) throughout. The presence of following traffic can also be varied to put pressure on the driver. After traveling several miles, the driver encounters a car going 40 mph about 400 ft ahead. As the gap between the cars closes, the lead car accelerates and maintains a 6-second headway. Two seconds before entering the intersection, the lead car accelerates away subtly (at 3 ft/sec2) to ensure that it poses no obstacle to the driver's passage through the intersection.
The intersection has a car positioned in each crossing lane (car C and car B) both waiting to cross perpendicular to the driver (Figure 1). Safe passage of the lead car implied that the upcoming intersection was not a four-way stop and that the two stopped vehicles were aware of cross-traffic and would continue to wait for the driver to pass. As the driver approaches to within about 4.0 seconds of the intersection, car B (or C) pulls out in front of the driver. This illegal incursion blocks the driver's path across the entire lane (Figure 1). This surprise event requires immediate decision making and action by the subject to avert a crash. Optimal response involves releasing the accelerator, applying the brake, and making steering corrections as needed to remain within the lane (safe avoidance). It is also possible to avoid a collision with suboptimal responses by swerving onto the shoulder of the road or into the left lane (unsafe avoidance). Here, the occurrence of obstacles or oncoming traffic would create the potential for a near miss or an injury in a secondary collision.

Figure 1. Schematic depiction of a simulated intersection incursion. The driver (in car D) has been safely following approximately 6 seconds behind a lead vehicle A. Car A passes safely through the intersection, creating the expectation that the participant could also safely pass. However, the driver's approach to within 4 seconds of intersection creates an illegal incursion by car B, entering the intersection from the participant's right side and creating the potential for a collision. To avoid collision with the incurring vehicle, the driver has to perceive, attend to, and interpret the roadway situation; formulate an evasive plan; and then exert appropriate action upon the accelerator, brake, or steering controls, all under pressure of time.
Analysis of Driving Performance
Experimental performance data are digitized at 30 Hz and reduced to means, SDs, or counts for each virtual road segment. Simulator output includes steering wheel position (in radians or degrees), normalized accelerator and brake position (i.e., scale of pedal depression ranging from 0-100%, see Figure 2), lateral and longitudinal acceleration (measured as acceleration due to gravity), headway (distance to the lead vehicle in meters or feet), time to collision (in seconds), and speed (in mph or kilometers per hour). A crash detection algorithm is used to help identify crashes.
Driving performance is also recorded at 30 frames per second using miniature "lipstick" cameras mounted unobtrusively within the vehicle. A forward camera records the scene observed by the driver and provides a backup record of the driver's lane tracking. Another camera directed at the driver allows evaluation of the subject's gaze in regions of interest in the car and on the virtual road. Synchronization of digital and video data streams facilitates the inspection of artifacts and allows review of potential driver safety errors in the moments preceding a crash.

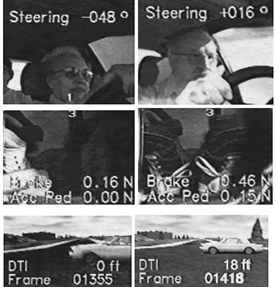
Figure 2. Left column: A patient with Alzheimer disease (S52). Right column: A control subject (S105). Views during the simulated intersection incursion. Top: Views of drivers' faces/superimposed steering readout. Middle: View of drivers' feet. Bottom: Roadway views show vehicle incurring from the right just before crash (DTI = distance to the intersection midpoint). Note: Objects appear closer in the simulator.
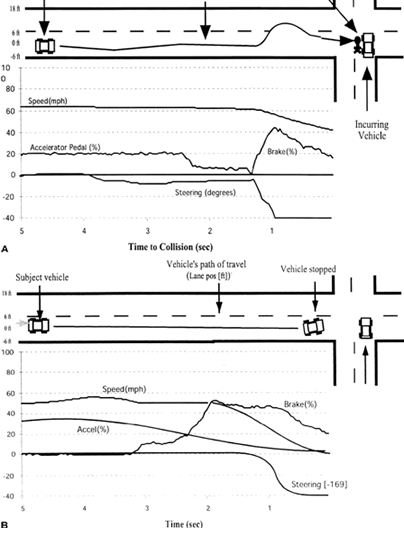
S52 crashed at 40 miles per hour into the incurring vehicle. In the final moments, she made ineffective brake and steering adjustments. Her gaze was directed forward, suggesting she should have seen the vehicle ahead (see Figure 3A). S105 stopped in time. This subject used both feet to operate the control pedals (see Figure 3B).
Results
We have used this paradigm to examine several issues including age-related differences in car following performance, and dual task performance with car following as one of the tasks (this study will be presented at Driving Assessment 2005). Variations in amplitude of the driving signal can also be used to manipulate workload (i.e., greater amplitude results in a greater variation in lead vehicle speed). The overall pattern of results shown below can vary according to the vehicle dynamics. We have used a simple linear control model for acceleration/deceleration that approximates most vehicle dynamics.

Figure 3. Plots of driver control in the simulated intersection incursion. Common ordinate scale shows vehicle speed, percentage of pedal application for accelerator and brake, and steering wheel rotations in degrees (upward deflections are CCW rotations). Path and lane positions of driver and other vehicles are depicted to scale at top. (A) S52, a patient with Alzheimer disease. (B) S105, a control subject. The control subject began braking immediately after letting off the accelerator.
Driving performance is also recorded at 30 frames per second using miniature "lipstick" cameras mounted unobtrusively within the vehicle. A forward camera records the scene observed by the driver and provides a backup record of the driver's lane tracking. Another camera directed at the driver allows evaluation of the subject's gaze in regions of interest in the car and on the virtual road. Synchronization of digital and video data streams facilitates the inspection of artifacts and allows review of potential driver safety errors in the moments preceding a crash.

Figure 2. Left column: A patient with Alzheimer disease (S52). Right column: A control subject (S105). Views during the simulated intersection incursion. Top: Views of drivers' faces/superimposed steering readout. Middle: View of drivers' feet. Bottom: Roadway views show vehicle incurring from the right just before crash (DTI = distance to the intersection midpoint). Note: Objects appear closer in the simulator.
S52 crashed at 40 miles per hour into the incurring vehicle. In the final moments, she made ineffective brake and steering adjustments. Her gaze was directed forward, suggesting she should have seen the vehicle ahead (see Figure 3A). S105 stopped in time. This subject used both feet to operate the control pedals (see Figure 3B).

