Car Following: John Andersen
Driving Scenarios
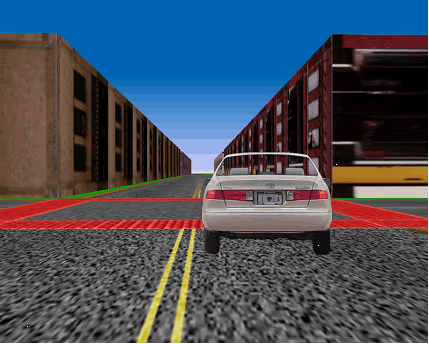
The driving scenario consists of following a lead vehicle on a two lane city road with adjacent buildings (Figure 1). No other traffic is present. The presence of buildings is important as it provides the driver with information about their own vehicle speed. Drivers are presented with a car following scenario in which the lead vehicle varied its velocity according to a sum of three equal-energy sinusoids (i.e., the peak accelerations and decelerations of each sine wave in the signal were equivalent). The three frequencies of velocity change were 0.033, 0.083, and 0.117 Hz. We determined these three frequencies based on extensive work examining reasonable frequency sets for car following. The corresponding amplitudes for these sinusoids were: 9.722, 3.889, and 2.778 kph. At the beginning of each trial run, drivers are given 5 seconds of driving at a constant speed (40 kph) 18 meters behind the constant speed lead vehicle to establish a perception of the desired distance to be maintained. The three sinusoids were out of phase with one another. The initial phase of the high and middle frequency wave was selected randomly with the phase value of the low frequency wave selected to produce a sum on the first frame of zero. This ensured that the beginning of the speed variation of the lead vehicle (following the 5 sec of constant speed) would always be 40 kph, yet the velocity profile of the lead car would vary from trial to trial.

Figure 1. Car following perspective view.
Dependent Variables
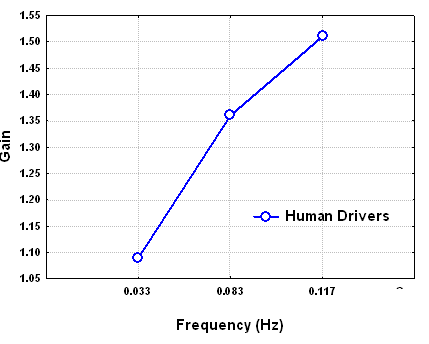
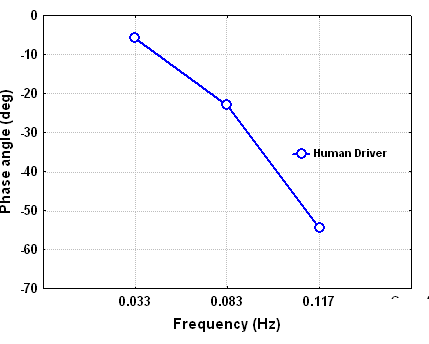
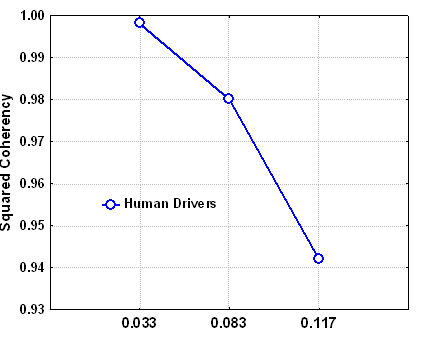
Dependent variables included RMS tracking error, gain and phase angle (derived from an FFT of response to the lead vehicle speed), and squared coherency. Figure 2 shows mean performance for gain, phase angle, and coherency.
Results
We have used this paradigm to examine several issues including age-related differences in car following performance, and dual task performance with car following as one of the tasks (this study will be presented at Driving Assessment 2005). Variations in amplitude of the driving signal can also be used to manipulate workload (i.e., greater amplitude results in a greater variation in lead vehicle speed). The overall pattern of results shown below can vary according to the vehicle dynamics. We have used a simple linear control model for acceleration/deceleration that approximates most vehicle dynamics.


Figure 2. Mean performance for gain (top), phase angle (middle), and coherency (bottom).
 Simulator Users Group (SUG)


 Contact Us | ©2006 The University of Iowa | College of Engineering | SIREN