55:148 Digital Image Processing
Chapter 11
Linear Discrete Image Transforms
Related Reading
Sections from Chapter 11 according to the WWW Syllabus.
Chapter 11 Overview:
- Image processing and analysis based on continuous or discrete image transforms is a
classic processing technique.
- Transforms are widely used in image filtering, image data compression, image
description, etc.
Basic theory
- Let an image f be represented as an M x N matrix of integer numbers


- If P and Q are non-singular (non-zero determinants), inverse matrices exist and

- If P and Q are both symmetric (M=M^T), real, and orthogonal (M^T M = I), then

and the transform is an orthogonal transform.
Fourier transform
- The discrete Fourier transform is analogous to the continuous one and may be efficiently
computed using the fast Fourier transform algorithm.
- The properties of linearity, shift of position, modulation, convolution, multiplication,
and correlation are analogous to the continuous case, with the difference of the discrete
periodic nature of the image and its transform.
- Let
 JJ be a
transform matrix of size J x J :

- The discrete Fourier transform can be defined according to equation (11.2)


- The inverse transform matrix is

- and the inverse Fourier transform is given by

- The kernel function of the discrete transform (11.8) is

- Considering implementation of the discrete Fourier transform, equation (11.8) can be
modified

- The term in square brackets ... one-dimensional Fourier transform of the m-th line can
be computed using standard fast Fourier transform (FFT) procedures (usually assuming N=2k
).
- Each line is substituted with its Fourier transform, and the one-dimensional discrete
Fourier transform of each column is computed.
- Periodicity is an important property of the discrete Fourier transform.


- Fourier spectra play an important role.
- The Fourier transform of a real function is a complex function

where R(u,v) and I(u,v) are, respectively, the real and imaginary
components of F(u,v).
- The magnitude function |F(u,v)| is called the frequency spectrum of image f(m,n)

- The phase spectrum
 (u,v)
and power spectrum P(u,v) are used


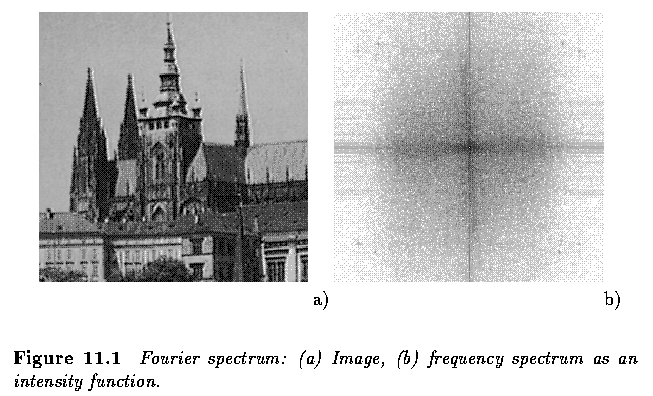
- ...two crosses are visible; one is formed by the image borders and depicts the x and y
axes in the spectrum.
- ... the second is rotated by approximately 10 o anti-clockwise with respect
to the first. This cross comes from the image data its directions correspond to the main
edge directions present in the image.
- It is important to realize that the frequency spectrum lines seem to be rotated by 90
degrees with respect to the edge image edge directions because of the perpendicular
relationship between image edges and the image intensity changes (in this case, the
sinusoidal basis functions) assessing the frequency character of the edges.
Additional Examples
The following web site
gives additional information about Fourier Analysis of Images. This site is
part of the Image Processing
Learning Resources.
The Image
Toolbox Matlab Documentation provides examples of Fourier Analysis of Images
and gives practical examples. (quick
link to Fourier Transform documentation)
Practical Experiment 11.A - VIP Version
- Open VIP and load FFT.vip. ( you will
need the clown.pgm image )
- Modify the parameters of the sinusoidal image generator and observe the resulting
frequency spectrum - note the 90 degree rotation of the frequencies with respect to the
direction of edges in the generated image.
- Use non-integer number of sine waves in x- and y-directions - explain why the
spectrum contains additional horizontal and vertical lines. Modify the sin-generation
parameters to see vertical lines only.
- Use the inverse transform and see that the original image results.
- Connect the output of the Plus node to the input of the FFT - observe the spectrum.
Can you locate the portion of the spectrum that was caused by the added sinusoidal image?
Practical Experiment 11.A - Khoros Version
- Open cantata, use FFT.wksp.
- Modify parameters of the sinusoidal image generator and observe the resulting
frequency spectrum - note the 90 degree rotation of the frequencies with respect to the
direction of edges in the generated image.
- Use non-integer number of sine waves in x- and y-directions - explain why the
spectrum contains additional horizontal and vertical lines. Modify the sin-generation
parameters to see vertical lines only.
- Use the inverse transform and see that the original image results.
- Connect the output of the Add glyph to the input of the FFT - observe the spectrum.
Can you locate the portion of the spectrum that was caused by the added sinusoidal image?
- The Fourier transform is of great use in the calculation of image convolutions.


- Use of this relationship can reduce the computational load of calculating convolutions
very significantly (usually for convolution kernels larger than 7 x 7 ).
Hadamard transform
- The Fourier Transform consists of a projection onto a set of orthogonal
sinusoidal waveforms.
- The FT coefficients are called frequency components and the waveforms are
ordered by frequency.
- The Hadamard Transform consists of a projection onto a set of square waves
called Walsh functions.
- The HT coefficients are called sequence components and the Walsh functions
are ordered by the number of their zero-crossings.
- The Walsh functions are real (not complex) and take only the values +1 or
-1.
- A Hadamard matrix H_jj is a symmetric JxJ matrix with elements +1 and -1.
- The Hadamard matrix of second order is given by

- A Hadamard matrix of order 2J can be written as

- Hadamard matrices of orders other than powers of 2 exist, buty they are
not widely used in image processing.
- Inverse Hadamard matrices are easily computed as

- The Hadamard transform and its inverse are given by

- It can be seen that only matrix multiplication is necessary to compute a
Hadamard transformation, and further, only additions are computed during it.
- The Hadamard transform is sometimes called a Walsh-Hadamard transform, since
the base of the transformation consists of Walsh functions.
Discrete cosine transform
- There are four definitions of the discrete
cosine transform, sometimes denoted DCT-I, DCT-II, DCT-III, and DCT-IV.
- The most commonly used discrete cosine transform in image processing and compression is
DCT-II - using equation (11.2) and a square N x N image, the discrete transform matrix can
be expressed as


- In the two-dimensional case, the formula for a normalized version of the discrete cosine
transform (forward cosine transform DCT-II) may be written

- and the inverse cosine transform is

- Note that the discrete cosine transform computation can be based on the Fourier
transform - all N coefficients of the discrete cosine transform may be computed using a 2N
-point fast Fourier transform.
- Discrete cosine transform forms the basis of JPEG image compression.
Wavelets
- Wavelets represent another approach to decompose complex signals into sums
of basis functions.
- Fourier functions are localized in frequency but not in space, in the sense
that they isolate frequencies, but not isolate occurrences of those frequencies.
- Small frequency changes in a Fourier transform will produce changes everywhere
in the time domain.
- Wavelets are local in both frequency (via dilations) and time (via translations)
and therefore are able to analyze data at different scales or resolutions
better than simple sines and cosines.
- Sharp spikes and discontinuities normally take fewer wavelet bases to represent
than if sine-cosine basis functions are used.
- These types of signals generally have a more compact representation using
wavelets than with sine-cosine functions.
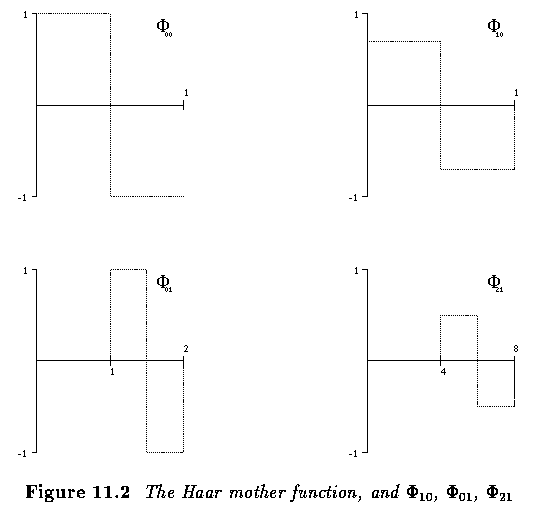
- In the same way as Fourier analysis, wavelets are derived from a basis function
called the Mother function or analyzing wavelet.
- The simplest Mother function is the Haar Mother function shown below.
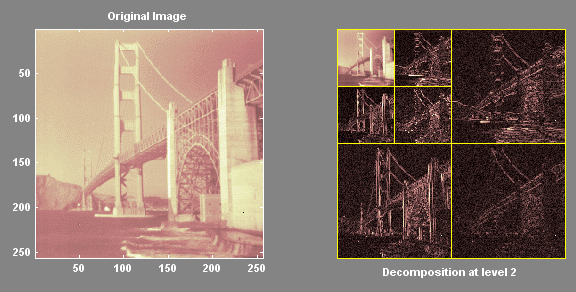
Haar wavelet coefficients. The coefficients in the upper left
corner are related to a low resolution image while the other panels correspond
to high resolution features.
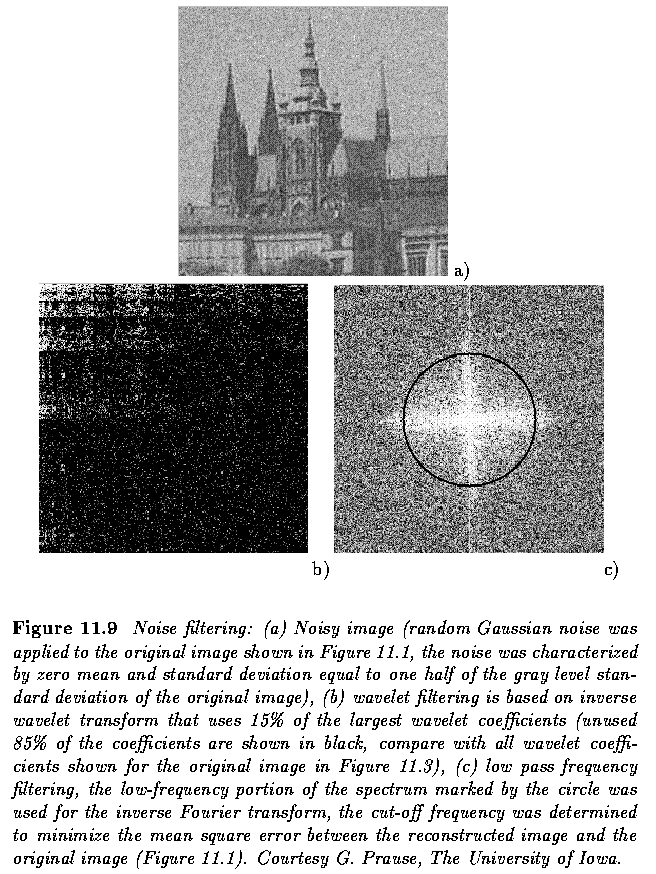
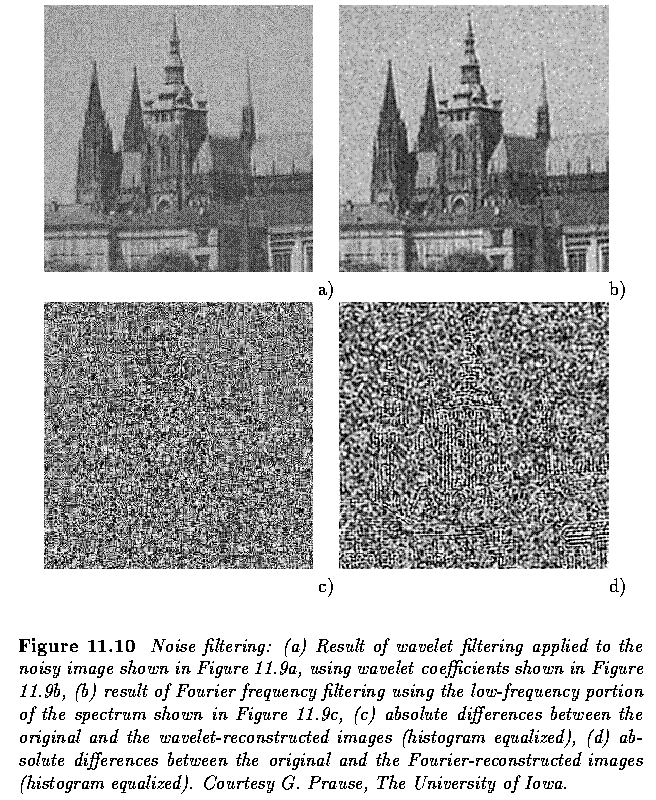
- Wavelets are often used for data compression and image noise suppression.
Additional Examples
The Wavelet
Toolbox Matlab Documentation provides examples of Wavelet Analysis of Images
and gives practical examples.
Other orthogonal image transforms
- Many other orthogonal image transforms exist.
- Hadamard, Paley, Walsh, Haar, Hadamard-Haar, Slant, discrete sine transform, wavelets,
...
- The significance of image reconstruction from projections can be seen in computed
tomography (CT), magnetic resonance imaging (MRI), positron emission tomography (PET),
astronomy, holography, etc., where image formation is based on the Radon transform.
Applications of orthogonal image transforms
- Many filters used in image pre-processing were presented - the convolution masks in most
cases were used for image filtering or image gradient computation.
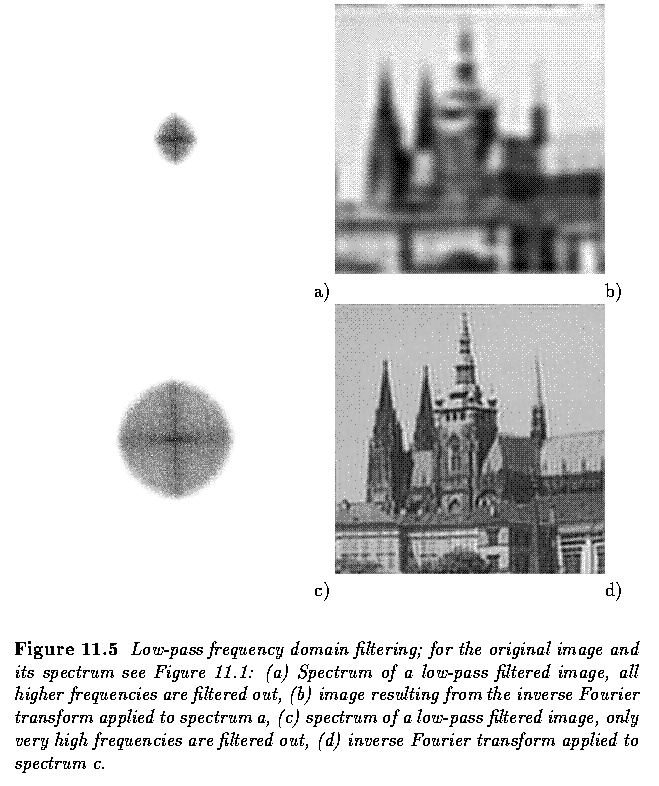
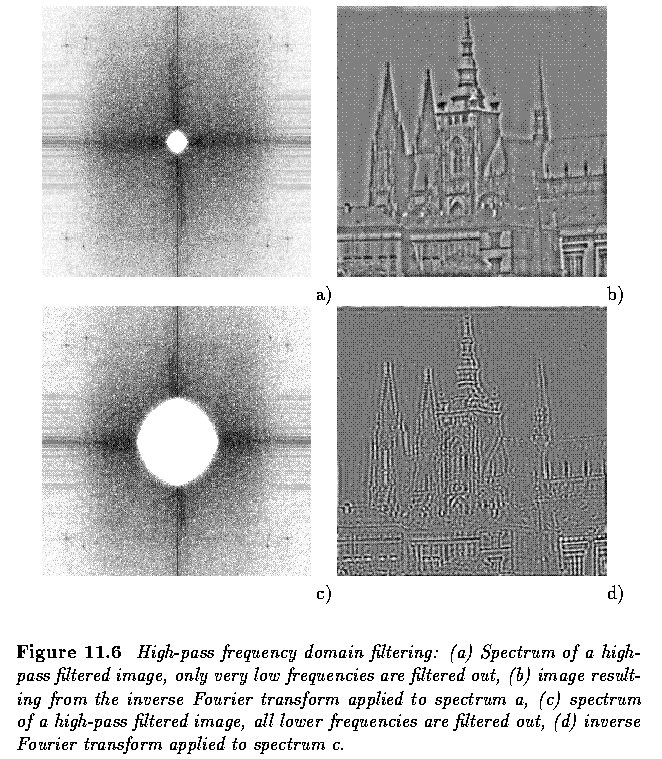
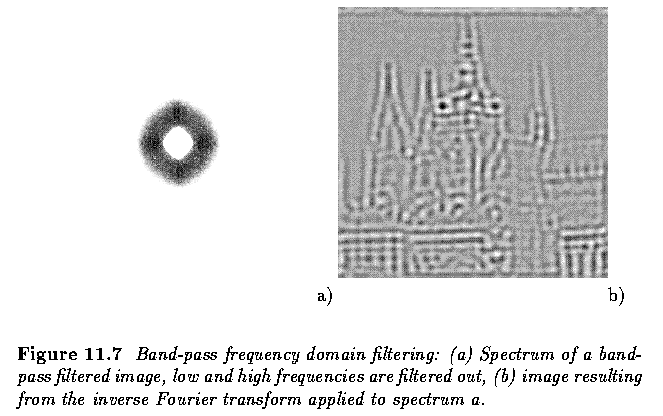
- In the frequency domain, such operations are usually called spatial frequency filtering.
- A convolution filter h can be represented by its Fourier transform

(term-by-term multiplication, not a matrix multiplication)
- The filtered image g can be obtained by applying the inverse Fourier transform to G.
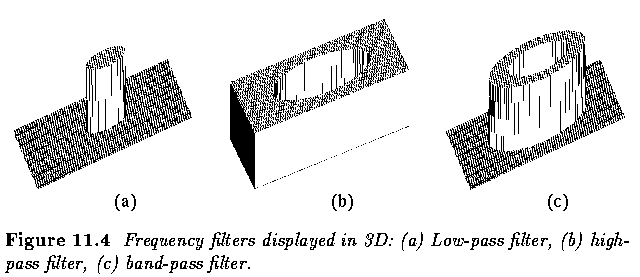
- Some basic examples of spatial filtering are linear low-pass and high-pass frequency
filters.
Practical Experiment 11.B - VIP Version
- Open VIP, use lpfhpf.vip.
- Apply low-pass and high-pass filtering using a variety of cut-off frequencies
- Look at the frquency spectrum of the sf.png
image - where are the two diagonal lines in the NW and SE quadrants coming
from?
- Apply to other image(s).
Practical Experiment 11.B
- Khoros Version
- Open cantata, use lpfhpf.wksp.
- Apply low-pass and high-pass filtering using a variety of cut-off frequencies
- Look at the frquency spectrum of the sf.pgm image - where are the two diagonal lines
in the NW and SE quadrants coming from?
- Apply to other image(s).
Practical Experiment 11.C - VIP
Version
- Open VIP, use FFT2.vip ( you will
again need the clown.pgm image ).
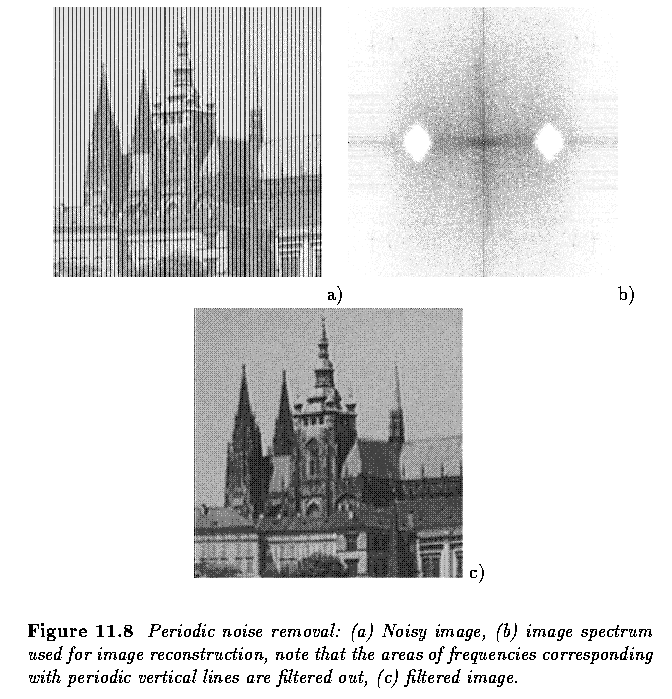
- Analyze the workspace - what is the role of the two Gaussian nodes?
- Modify the workspace parameters (or structure) to remove the sinusoidal noise in the
frequency space.
- After you finish the precvious step, modify the partameters of the sinusoidal signal
superimposed over the clown image. Can you predict the parameters of the Gaussians to
remove the sinusoidal noise without looking at the spectrum of the corrupted image?
Practical Experiment 11.C - Khoros Version
- Open cantata, useFFT2.wksp.
- Analyze the workspace - what is the role of the two Gaussian glyphs?
- Modify the workspace parameters (or structure) to remove the sinusoidal noise in the
frequency space.
- After you finish the precvious step, modify the partameters of the sinusoidal signal
superimposed over the clown image. Can you predict the parameters of the Gaussians to
remove the sinusoidal noise without looking at the spectrum of the corrupted image?
Last Modified: December 1, 2003
![[Go Back]](../IMAGES/next.gif)


![]()

![]()
![]()

![]()


![]()
![]()


![]()


![]()


![]()


